library(ggplot2)
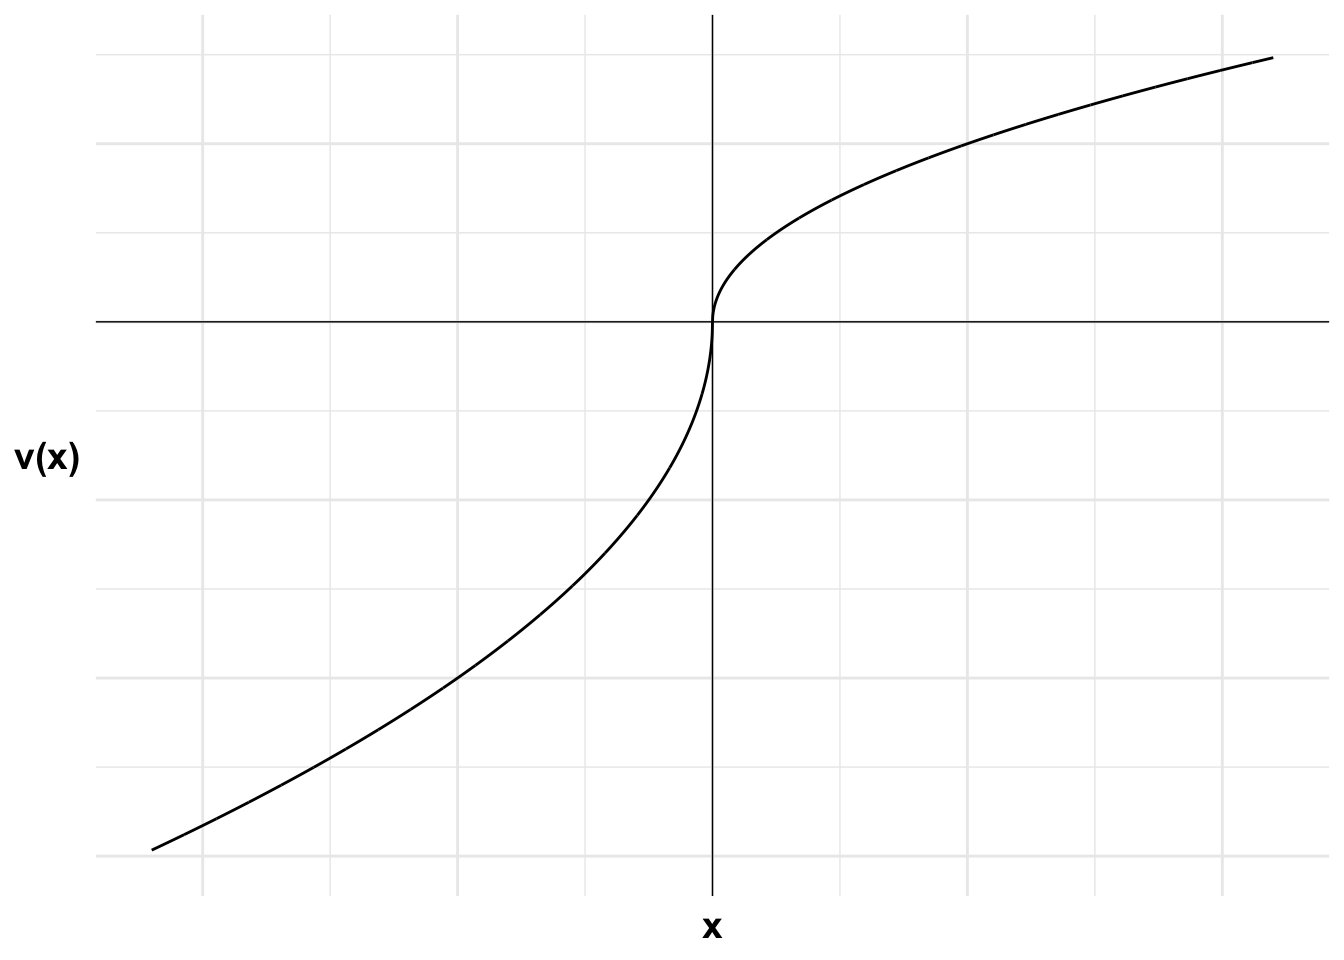
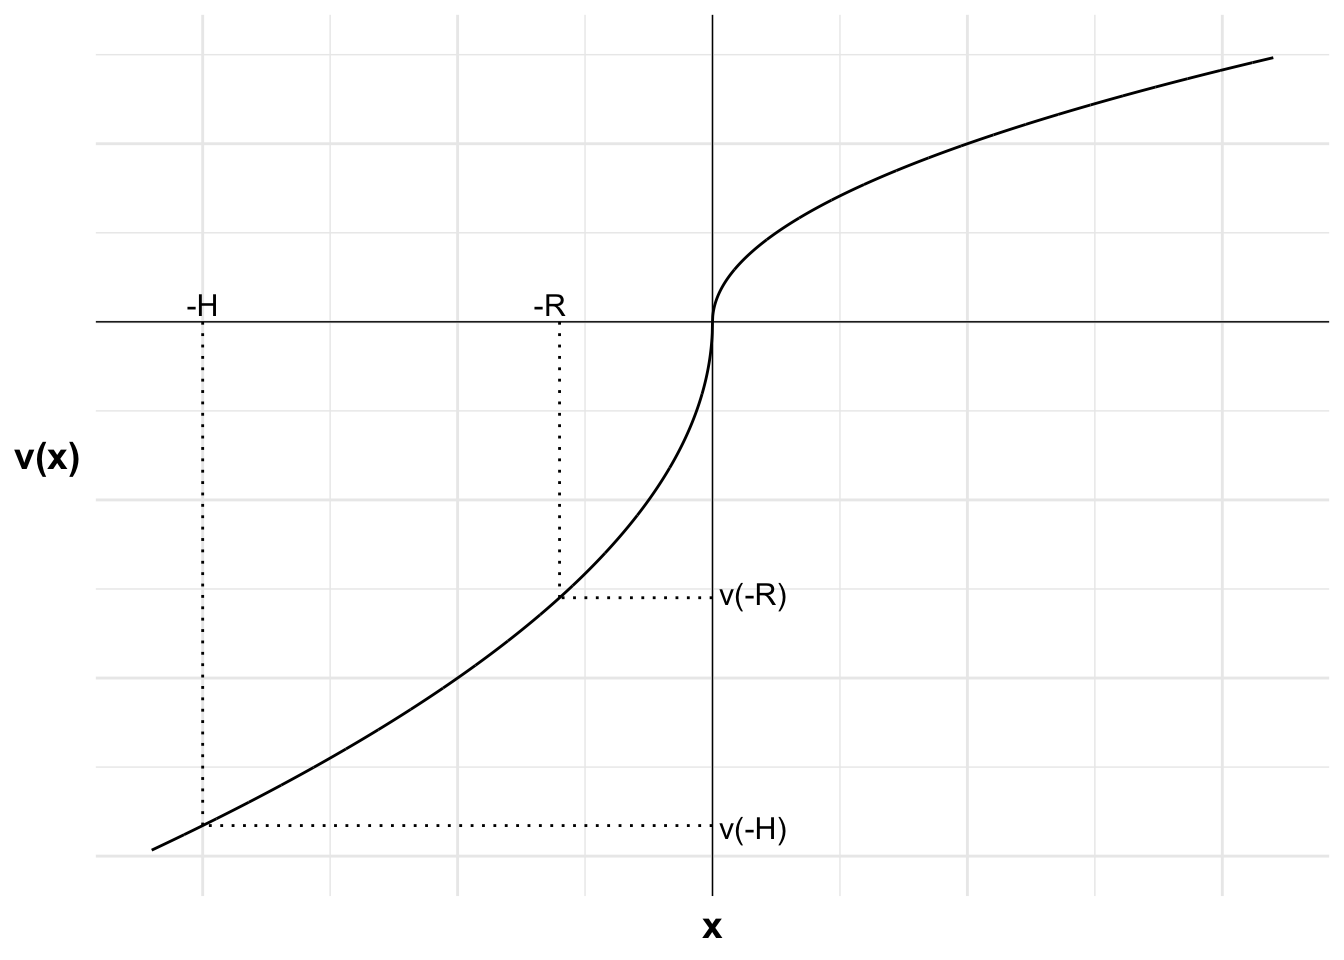
u <- function(x){
ifelse (x >= 0, x^0.5, -2*(-x)^0.5)
}
df <- data.frame(
x = seq(-220, 1000, 0.1),
y = u(seq(-220, 1000, 0.1))
)
#Variables for plot (may not match labels as not done to scale)
#Payoffs from gamble
x1 <- 560 #loss
x2 <- 1000 #win
ev <- 800 #expected value of gamble
xc <- 780 #certain outcome
px2<-(ev-x1)/(x2-x1)
ggplot(mapping = aes(x, y)) +
#Plot the utility curve
geom_line(data = df) +
geom_vline(xintercept = 0, linewidth=0.25)+
geom_hline(yintercept = 0, linewidth=0.25)+
labs(x = "x", y = "v(x)")+
# Set the theme
theme_minimal()+
#remove numbers on each axis
theme(axis.text.x = element_blank(),
axis.text.y = element_blank(),
axis.title=element_text(size=14,face="bold"),
axis.title.y = element_text(angle=0, vjust=0.5))+
#limit to y greater than zero and x greater than -8 (need -8 so space for y-axis labels)
coord_cartesian(xlim = c(-220, 1000), ylim = c(-30, 30))+
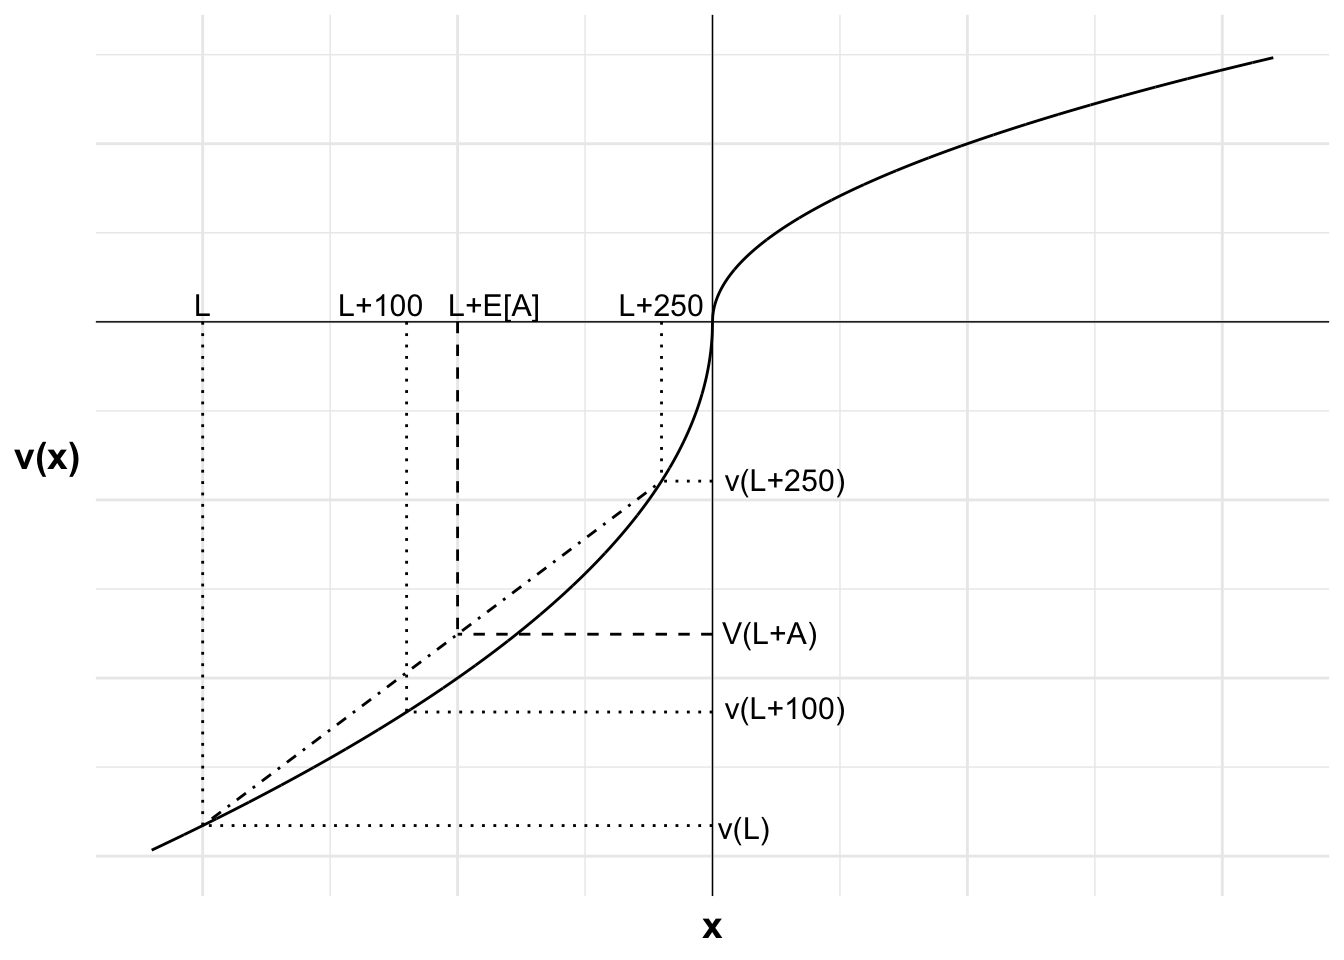
#Add labels 9,900, v(9,900) and line to curve indicating each
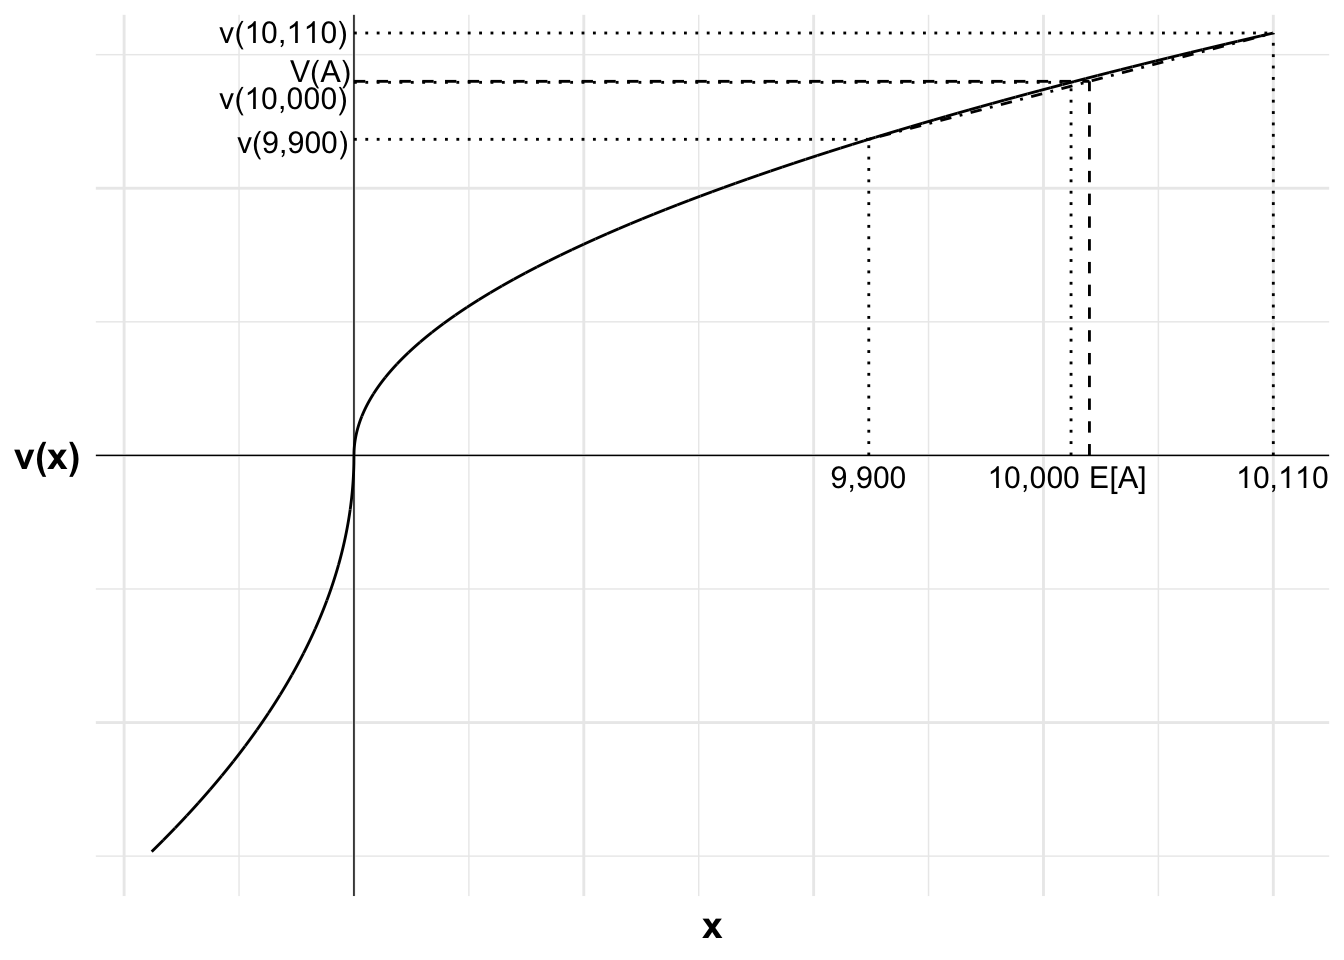
annotate("text", x = x1, y = 0, label = "9,900", size = 4, hjust = 0.5, vjust = 1.5)+
annotate("segment", x = x1, y = 0, xend = x1, yend = u(x1), linewidth = 0.5, colour = "black", linetype="dotted")+
annotate("segment", x = 0, y = u(x1), xend = x1, yend = u(x1), linewidth = 0.5, colour = "black", linetype="dotted")+
annotate("text", x = 0, y = u(x1), label = "v(9,900)", size = 4, hjust = 1.05, vjust = 0.6)+
#Add labels 10,000, v(10,000) and line to curve indicating each
annotate("text", x = xc, y = 0, label = "10,000", size = 4, hjust = 0.9, vjust = 1.5)+
annotate("segment", x = xc, y = 0, xend = xc, yend = u(xc), linewidth = 0.5, colour = "black", linetype="dotted")+
annotate("segment", x = 0, y = u(xc), xend = xc, yend = u(xc), linewidth = 0.5, colour = "black", linetype="dotted")+
annotate("text", x = 0, y = u(xc), label = "v(10,000)", size = 4, hjust = 1.05, vjust = 1.2)+
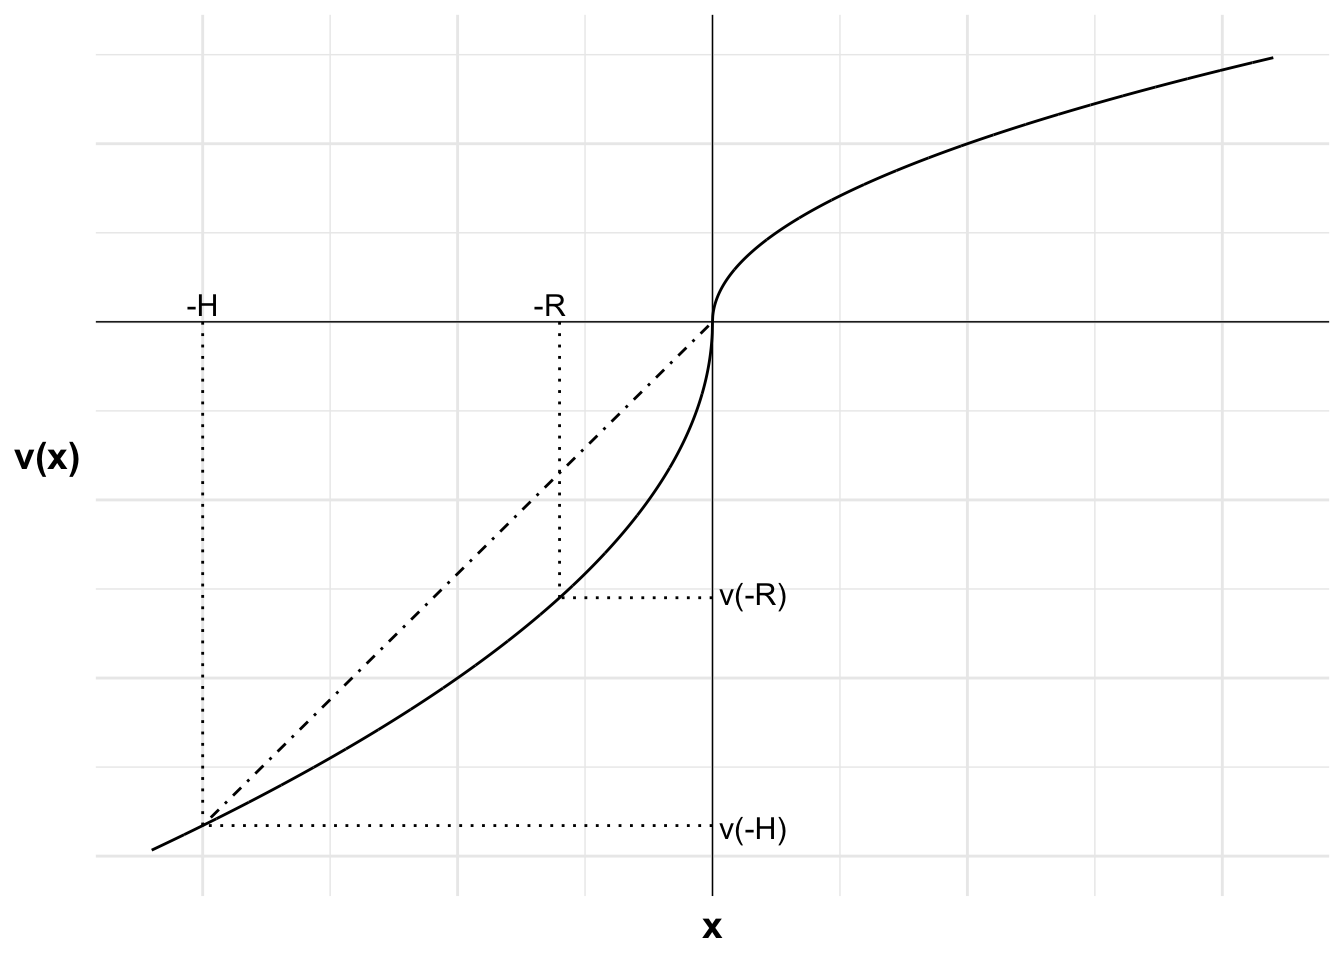
#Add expected utility line
annotate("segment", x = x1, xend = x2, y = u(x1), yend = u(x2), linewidth = 0.5, colour = "black", linetype="dotdash")+
#Add labels 10,110, v(10,110) and line to curve indicating each
annotate("text", x = x2, y = 0, label = "10,110", size = 4, hjust = 0.4, vjust = 1.5)+
annotate("segment", x = x2, y = 0, xend = x2, yend = u(x2), linewidth = 0.5, colour = "black", linetype="dotted")+
annotate("segment", x = 0, y = u(x2), xend = x2, yend = u(x2), linewidth = 0.5, colour = "black", linetype="dotted")+
annotate("text", x = 0, y = u(x2), label = "v(10,110)", size = 4, hjust = 1.05, vjust = 0.45)+
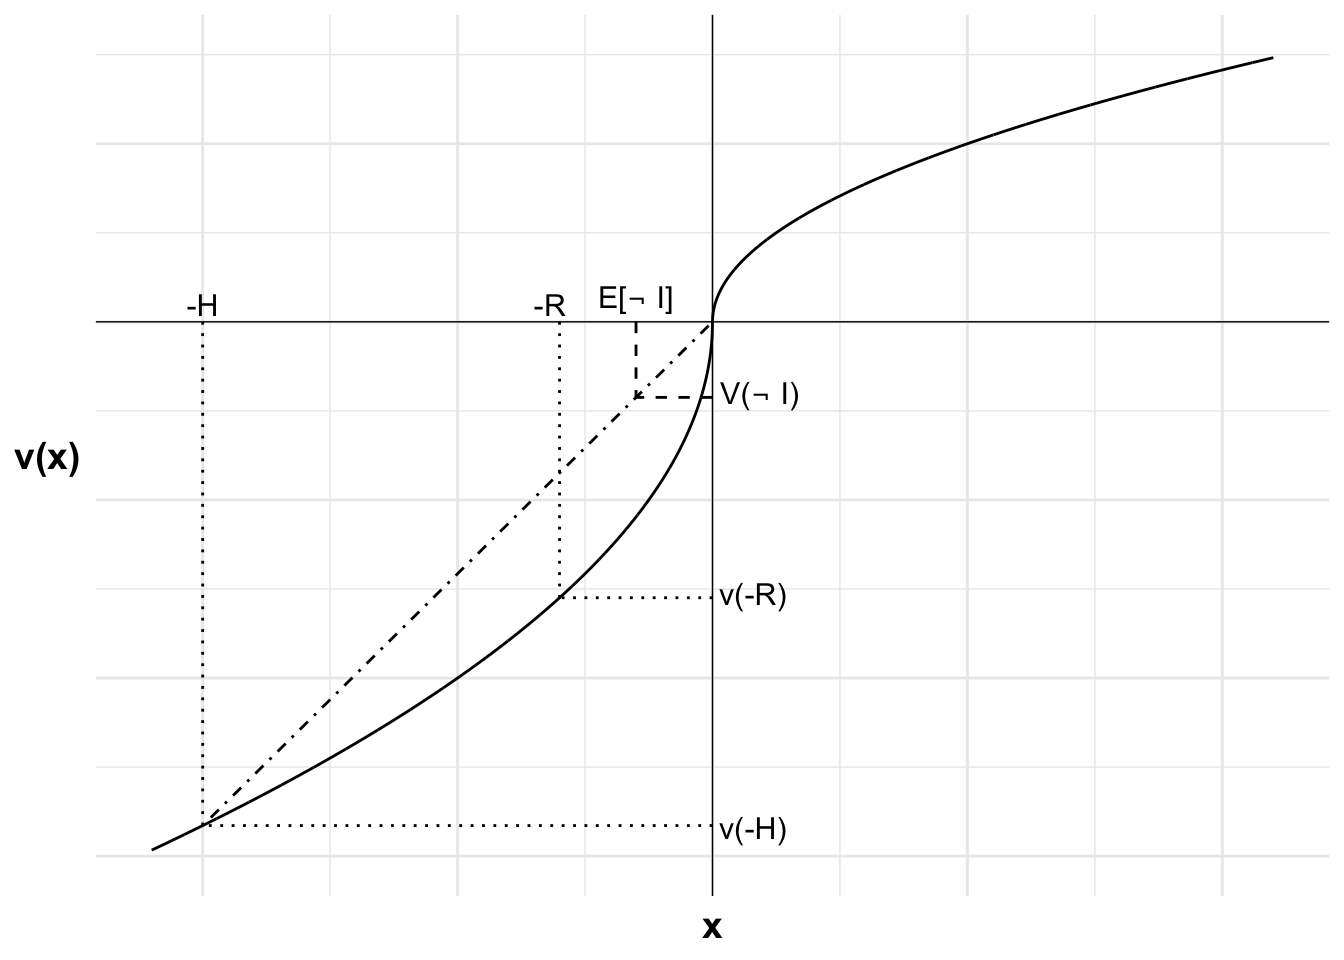
#Add labels E[A], V(A) and curve indicating each
annotate("text", x = ev, y = 0, label = "E[A]", size = 4, hjust = 0, vjust = 1.5)+
annotate("segment", x = ev, y = 0, xend = ev, yend = u(x1)+(u(x2)-u(x1))*px2, linewidth = 0.5, colour = "black", linetype="dashed")+
annotate("segment", x = 0, y = u(x1)+(u(x2)-u(x1))*px2, xend = ev, yend = u(x1)+(u(x2)-u(x1))*px2, linewidth = 0.5, colour = "black", linetype="dashed")+
annotate("text", x = 0, y = u(x1)+(u(x2)-u(x1))*px2, label = "V(A)", size = 4, hjust = 1.05, vjust = 0)