library(ggplot2)
u <- function(x){
log(x)
}
df <- data.frame(
x=seq(1,220,0.1),
y=NA
)
df$y <- u(df$x)
#Variables for plot (may not match labels as not done to scale)
x1<-30 #loss
W <- 115
x2<-200 #win
px2<-(W-x1)/(x2-x1)
ggplot(mapping = aes(x, y)) +
#Plot the utility curve
geom_line(data = df) +
geom_vline(xintercept = 0, linewidth=0.25)+
geom_hline(yintercept = 0, linewidth=0.25)+
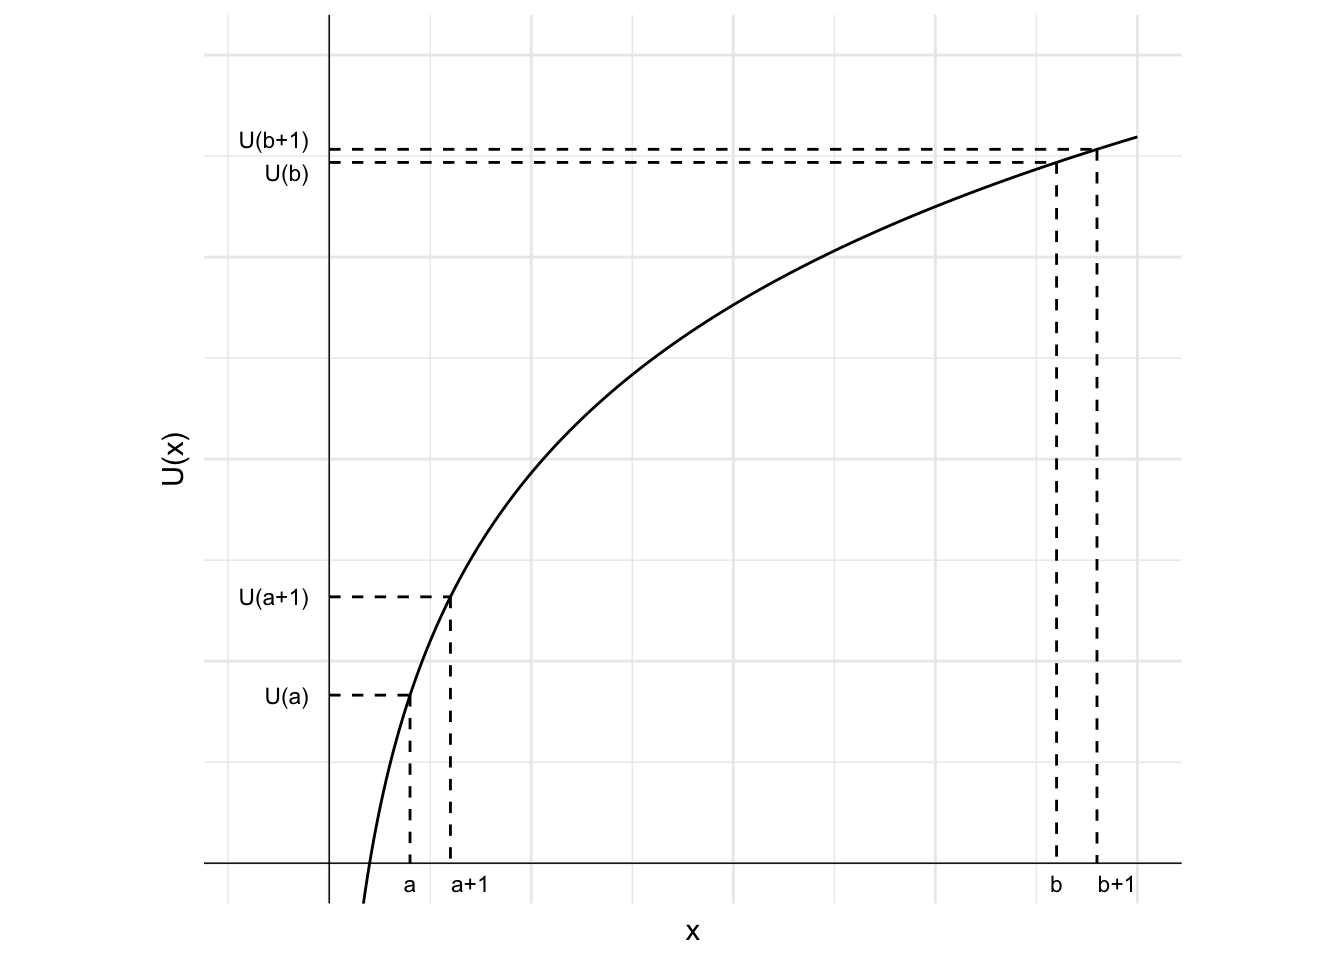
labs(x = "x", y = "U(x)")+
# Set the theme
theme_minimal()+
#remove numbers on each axis
theme(axis.text.x = element_blank(),
axis.text.y = element_blank(),
axis.title=element_text(size=14,face="bold"),
axis.title.y = element_text(angle=0, vjust=0.5))+
#set limits - need to include room for labels
coord_cartesian(xlim = c(-25, 220), ylim = c(-0.25, 6))+
#Add labels W-10, W-10 and line to curve indicating each
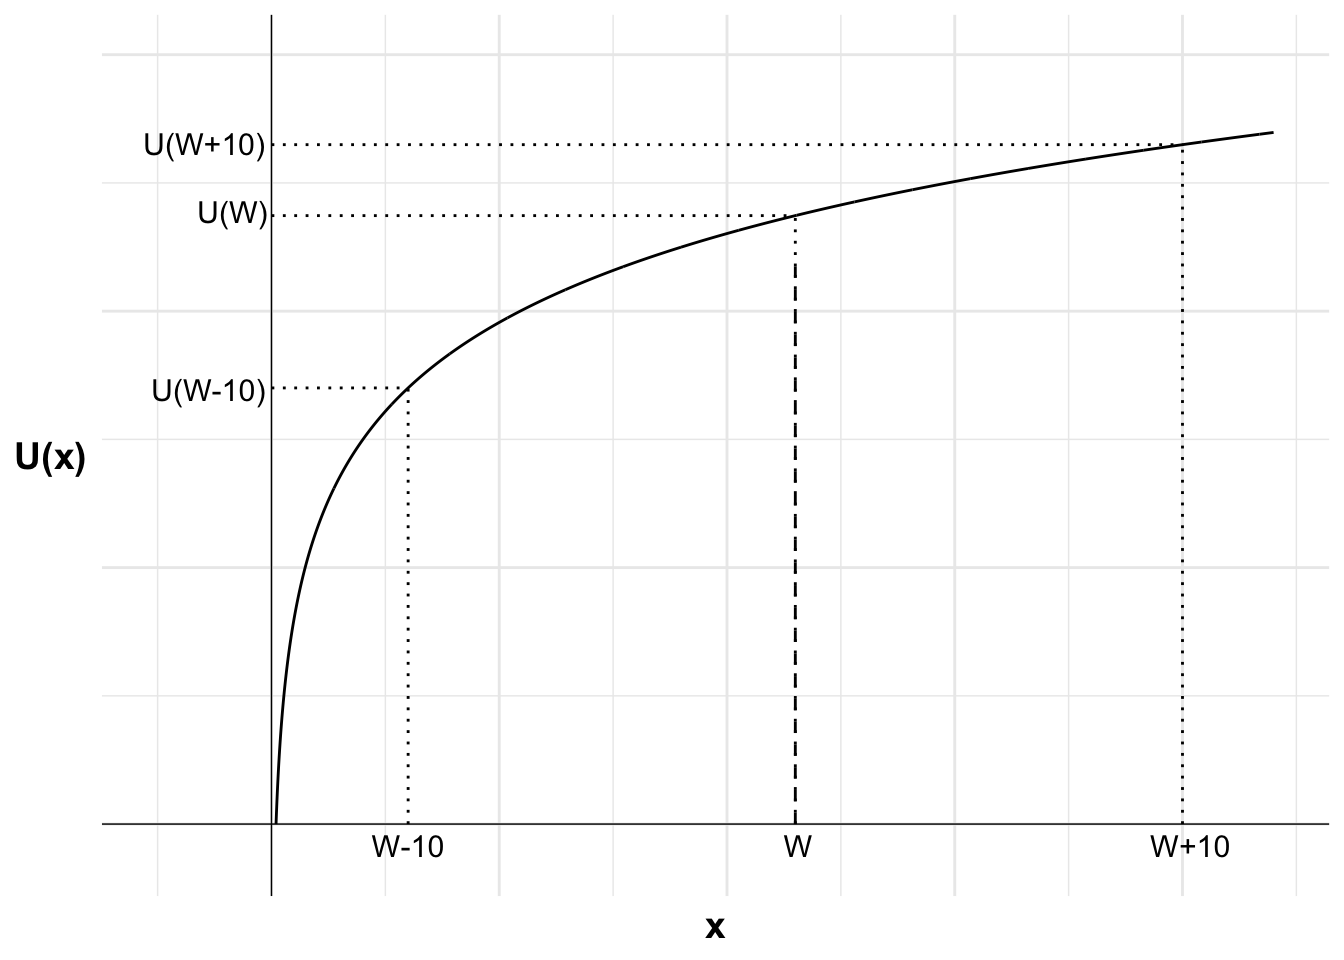
annotate("text", x = x1, y = 0, label = "W-10", size = 4, hjust = 0.5, vjust = 1.5)+
annotate("segment", x = x1, y = 0, xend = x1, yend = u(x1), linewidth = 0.5, colour = "black", linetype="dotted")+
annotate("segment", x = 0, y = u(x1), xend = x1, yend = u(x1), linewidth = 0.5, colour = "black", linetype="dotted")+
annotate("text", x = 0, y = u(x1), label = "U(W-10)", size = 4, hjust = 1.05, vjust = 0.6)+
#Add line to curve indicating utility of wealth
annotate("segment", x = W, y = 0, xend = W, yend = u(W), linewidth = 0.5, colour = "black", linetype="dotted")+
annotate("segment", x = 0, y = u(W), xend = W, yend = u(W), linewidth = 0.5, colour = "black", linetype="dotted")+
annotate("text", x = 0, y = u(W), label = "U(W)", size = 4, hjust = 1.05, vjust = 0.3)+
#Add labels W+10, U(W+10) and line to curve indicating each
annotate("text", x = x2, y = 0, label = "W+10", size = 4, hjust = 0.4, vjust = 1.5)+
annotate("segment", x = x2, y = 0, xend = x2, yend = u(x2), linewidth = 0.5, colour = "black", linetype="dotted")+
annotate("segment", x = 0, y = u(x2), xend = x2, yend = u(x2), linewidth = 0.5, colour = "black", linetype="dotted")+
annotate("text", x = 0, y = u(x2), label = "U(W+10)", size = 4, hjust = 1.05, vjust = 0.45)+
#Add labels W, E[U(X)] and curve indicating each
annotate("text", x = W, y = 0, label = "W", size = 4, hjust = 0.4, vjust = 1.5)+
annotate("segment", x = W, y = 0, xend = W, yend = u(x1)+(u(x2)-u(x1))*px2, linewidth = 0.5, colour = "black", linetype="dashed")